Measures of community(infographic)
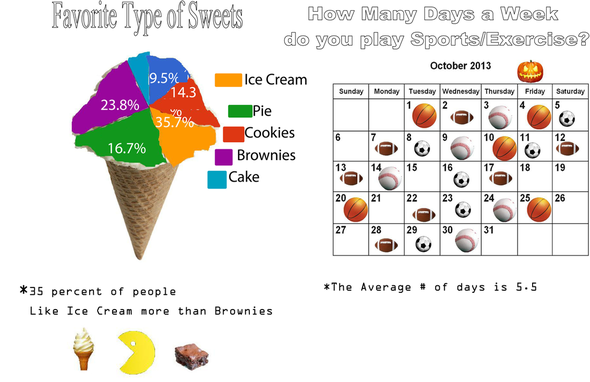
What my role was for this project was to create a graph and to use the data from doing a class survey. After finishing the survey, we had to use the information to create tables, then I had to figure out the average number of days. The kind of questions that I asked were ''What were your favorite kind of sweets?'' and ''How Many Days a Week do you play Sports/Exercise?''. What I learned was the average number of days people exercise a week is 5.5 and 35% of people like Ice Cream more than Brownies
